Results
Upon successful completion of a job, the “Visualize Results” and “Download Results” options become available in the jobs table (Figure 2). The results table displayed upon clicking the “Visualize Results” option is shown in Figure 3. Besides the table of calculated binding affinities for each protein-ligand pair, the screen also provides filtering and display options. A drop-down menu is available upon clicking the “Columns” button, where the user can specify the columns to be displayed in the table. Each of these properties can also be used as sorting and filtering criteria. Sorting can be performed by clicking the arrow button that appears upon hovering over any column header, and the filtering function can be accessed via the drop-down menu in the “Filters” button. The height of the rows can be adjusted via the “Density” button, and the “Export” button provides the option to download the properties table as a “.csv” file.
Note: Using the “export” option in the results table will download a file with only the columns displayed in the results table, while using the “Download Results” option in the jobs table (Figure 2) will preserve additional columns that were present in the input file.
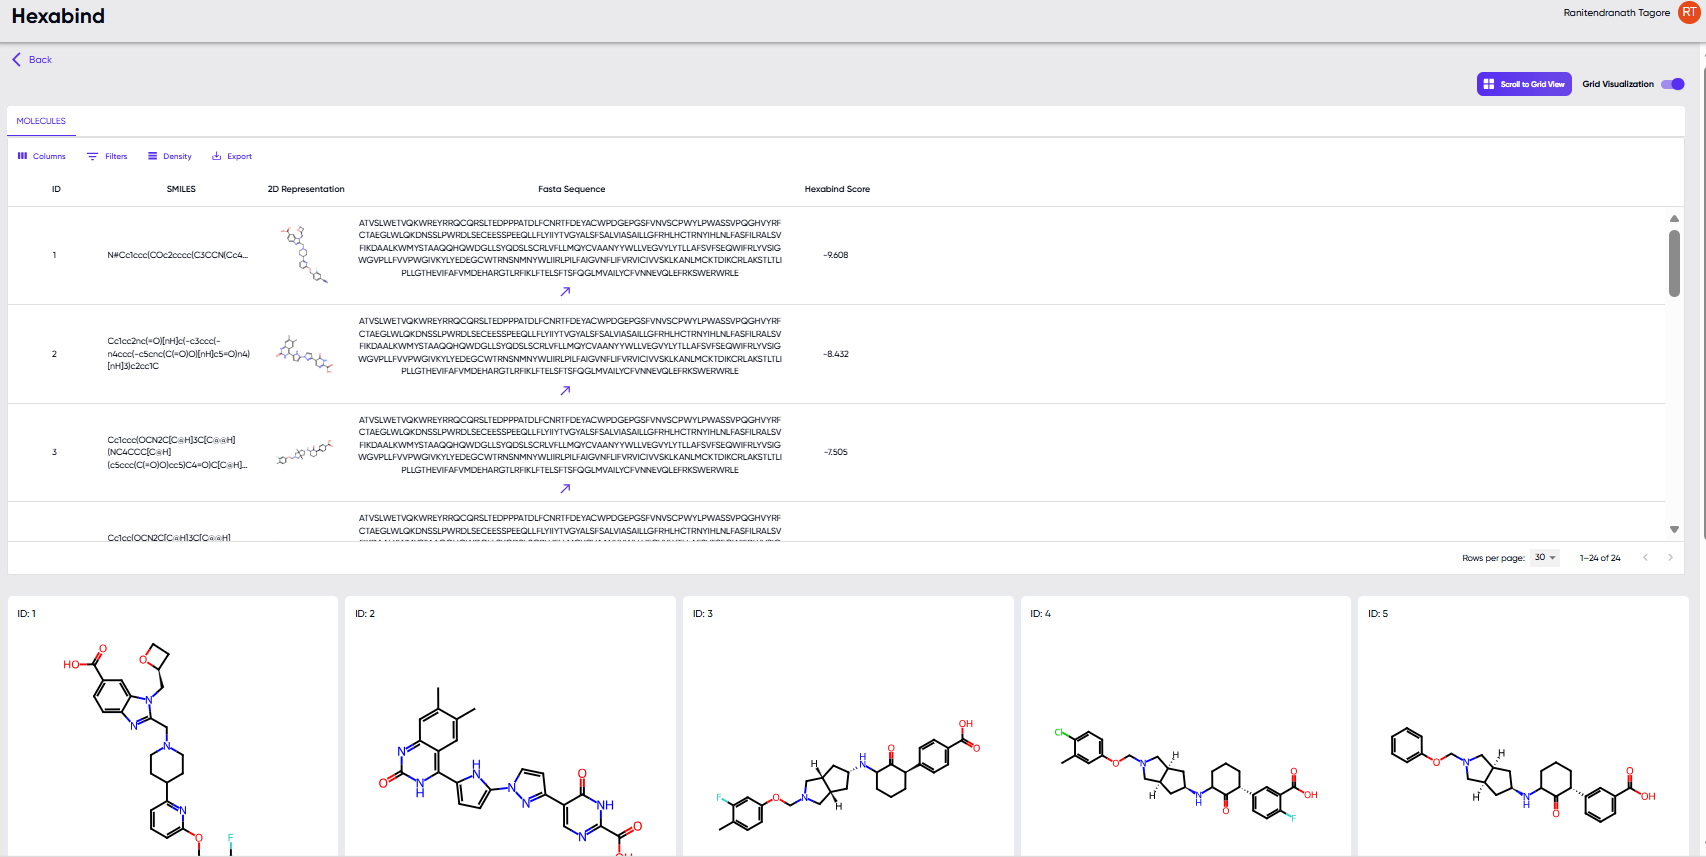
Figure 3: The table displayed upon clicking the “Visualize Results” option.
The “scroll to grid view” button provides larger 2D structure cards of the molecules in the results table, and clicking upon any of the cards pops it out in a still larger view along with its SMILE string.
Note: The “scroll to grid view” button is greyed out, unless activated by toggling the “grid visualization” toggle switch to the right of the button.