Visualize Results
Upon clicking the “Visualize Results” option in the “Actions” column, a table of ranked molecules, along with several of their properties is displayed.
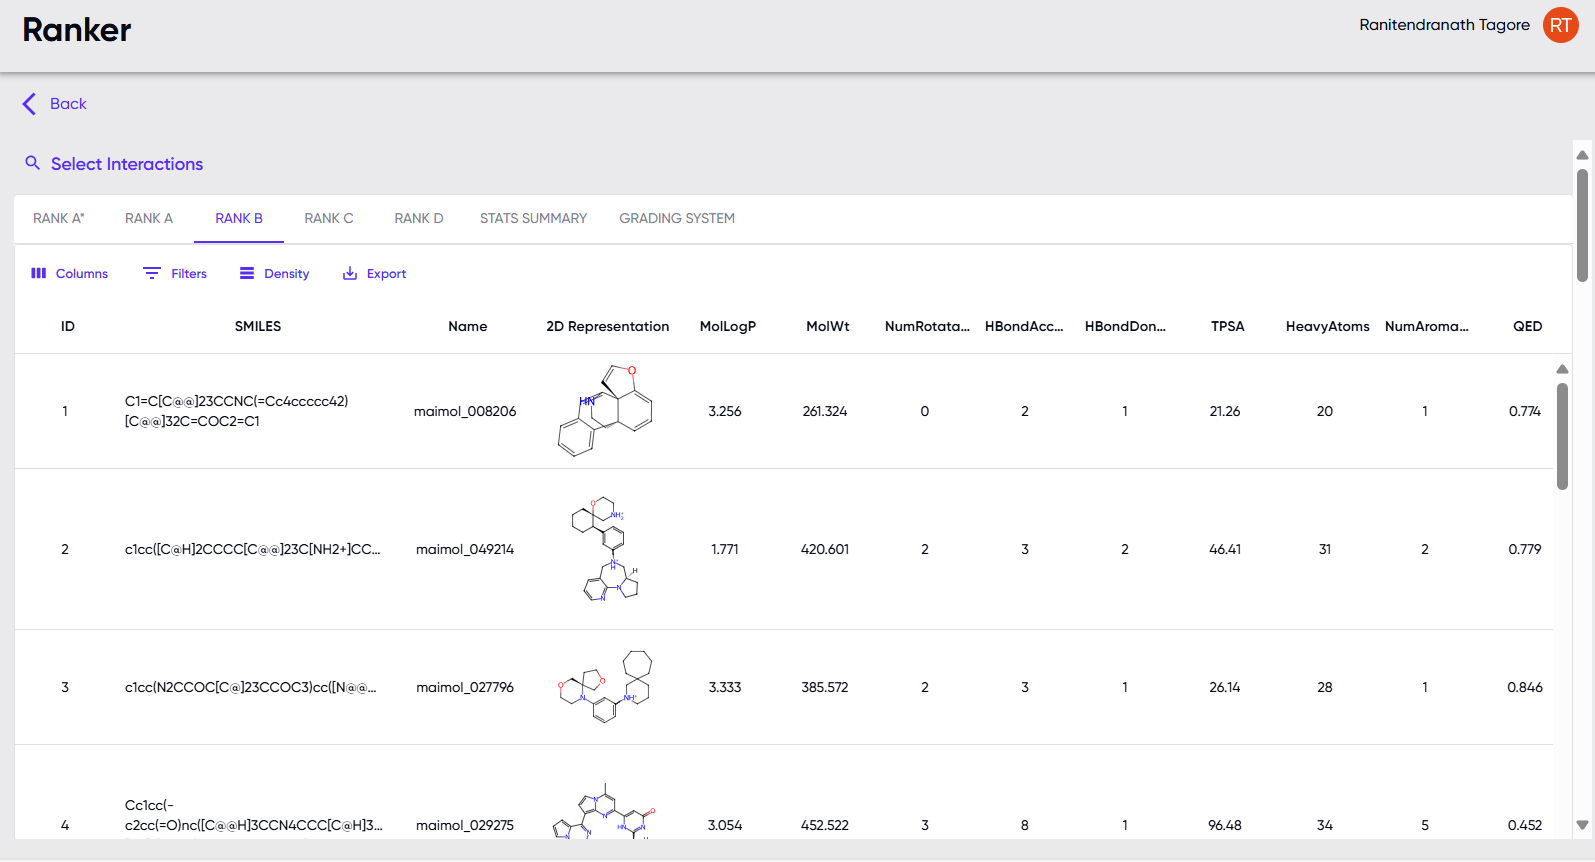

All available properties can be seen by scrolling to the right of the table as needed. While the other property names are mostly self-explanatory, the right-most column, “Concatenated Interactions” is a list of the non-covalent interactions (NCIs) detected between the molecule and the target binding pocket during docking.
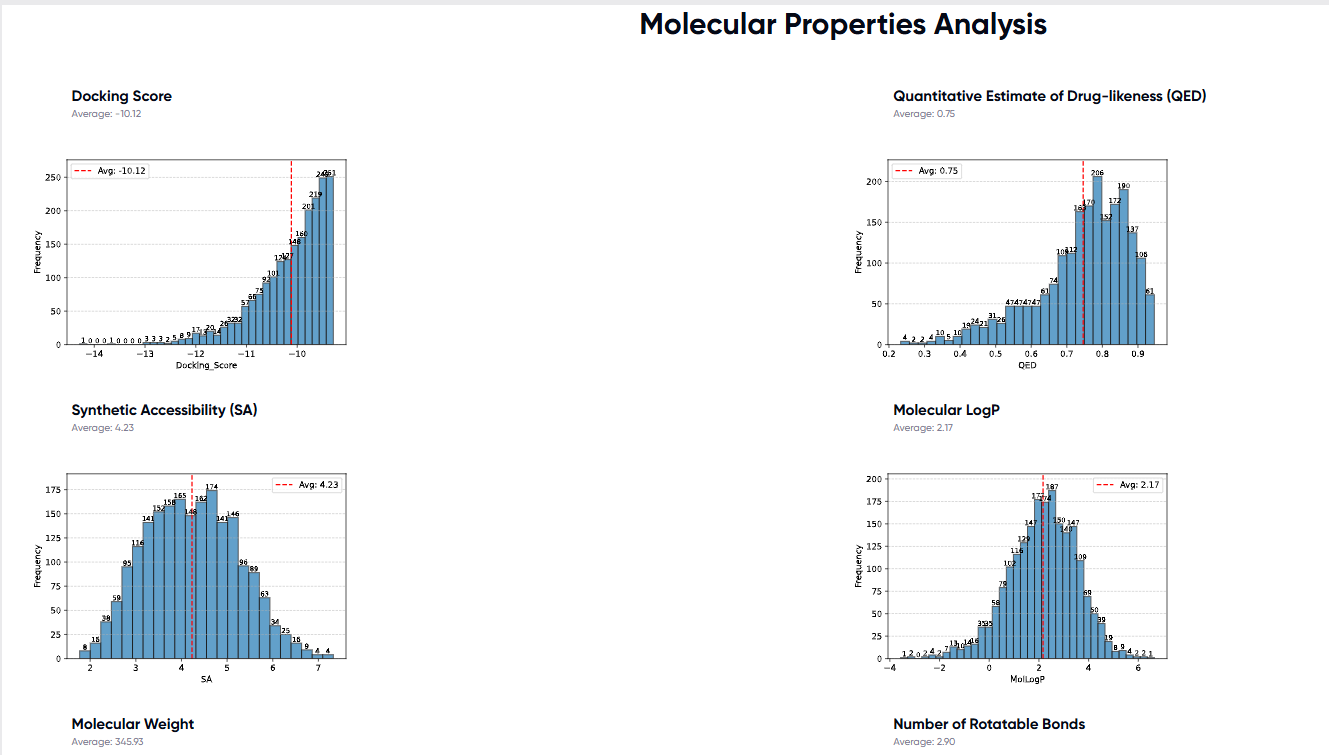
Upon scrolling below the table of molecules, the distribution of the tabulated properties for the entire set of ranked molecules can be seen as histograms.
Note that the table of molecules and properties opens by default in the “Rank B” tab. The significance of the Rank A*, Rank A, Rank B, Rank C, and Rank D tabs are explained under the “Grading System” tab.
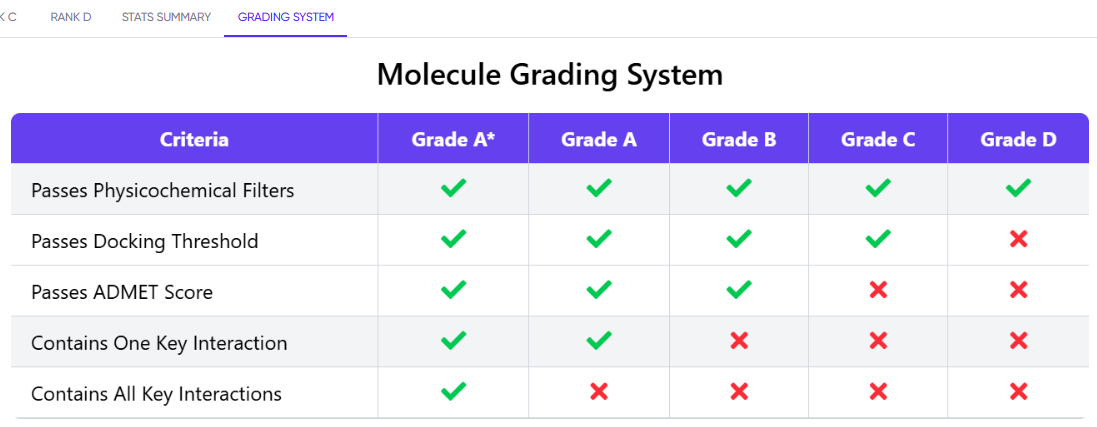
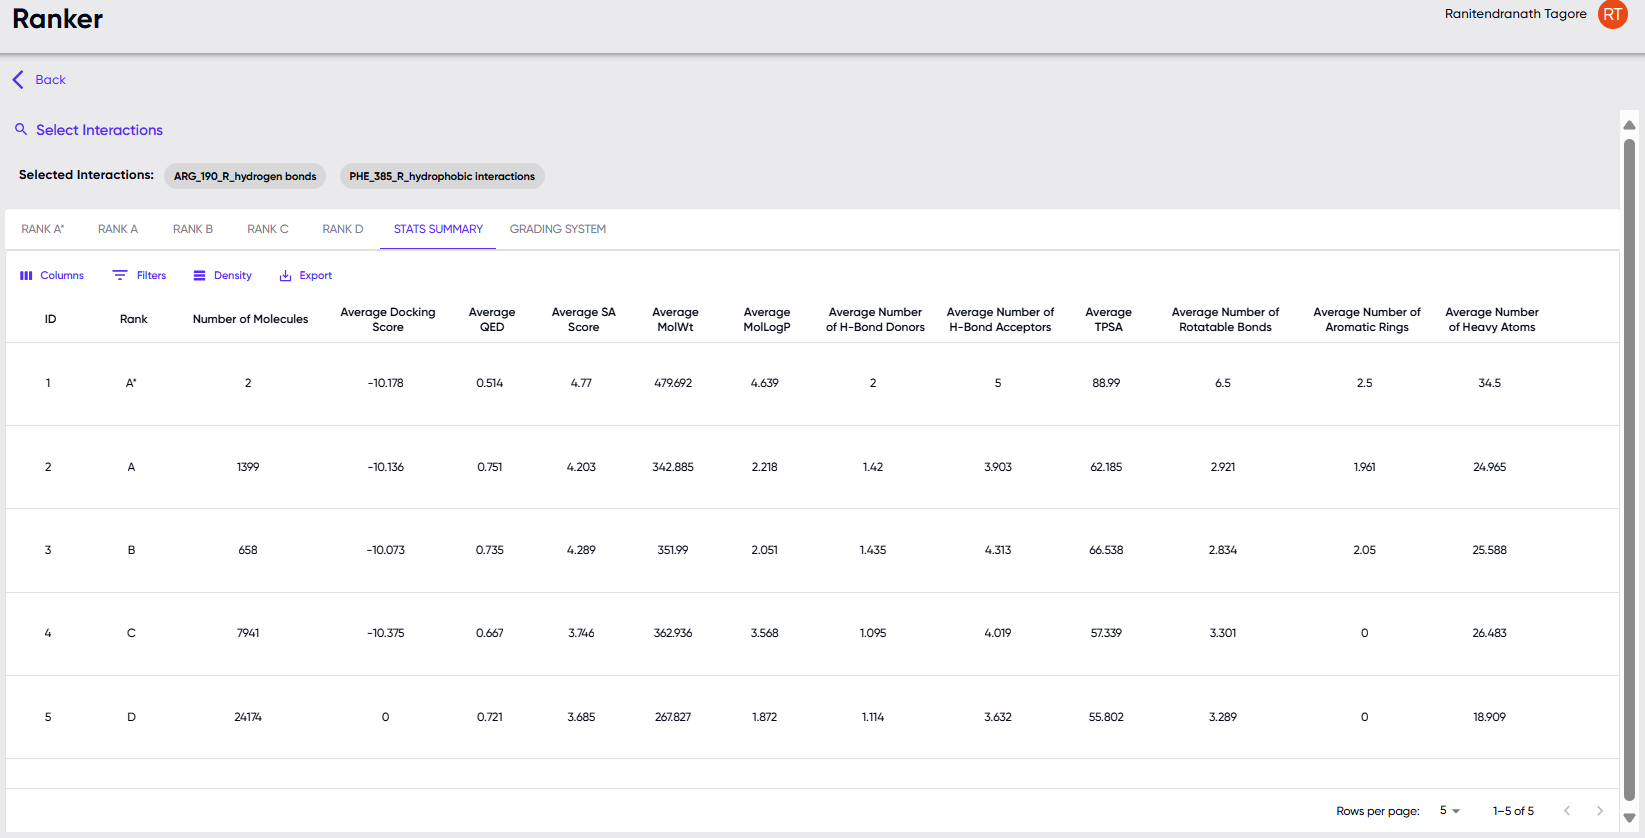
Since A and A* molecules are defined based on “Key Interactions”, these need to be supplied by the user for any molecules to show up under the A and A* tabs. Key interactions can be supplied by the user through the “Select Interactions” button on top of the table of ranked molecules.
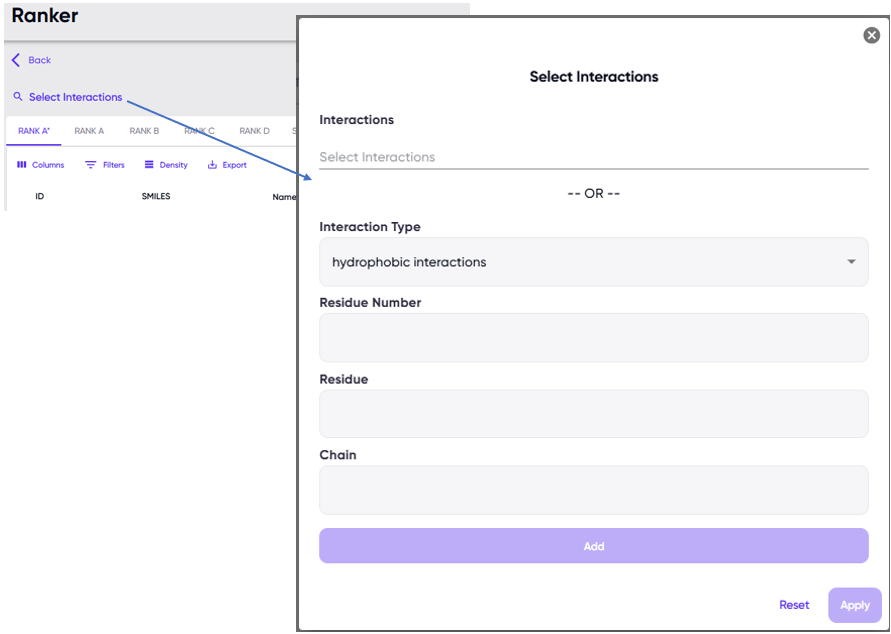
The interactions can be selected from a drop-down menu consisting of all interactions detected in the generated molecules, or by specifying the fields of interaction type, residue number, etc. The user can also type free text in the “Select Interactions” field, upon which the drop-down list will be narrowed down to the items that match the text being typed.
The “Stats Summary” tab displays a summary of the molecules for each letter grade/rank.
The tables under each tab (except the “Grading System” tab) are interactive:
- Specific columns can be hidden/shown
- The table can be sorted by the desired columns
- The rows can filtered by values in specific columns
- The number and density of rows in the display can be adjusted
- The table can be exported as a .csv file
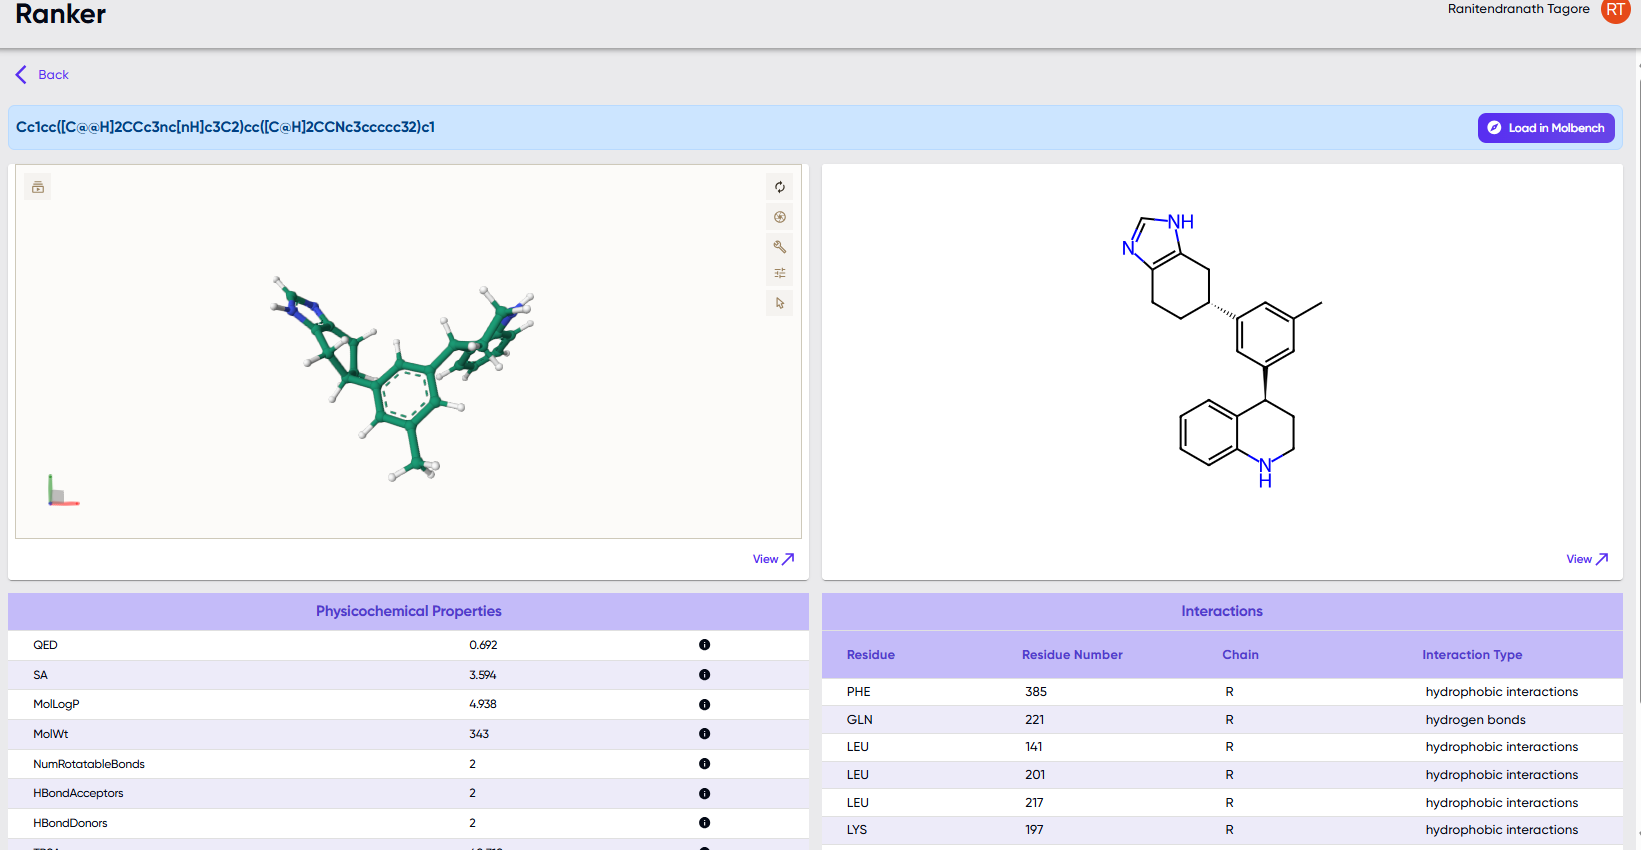
- Clicking on any row of the Rank A* - D tables will open up a new window with 2D and 3D representations of the molecule, and a tabulation of various properties of the molecule. This window also provides a link to the MolBench module, through the “Load in MolBench” button.