Results
(A) “Enter a SMILES string” option
The results screen upon successful completion of a job submitted via the “Enter a SMILES string” option is shown in Figure 4.
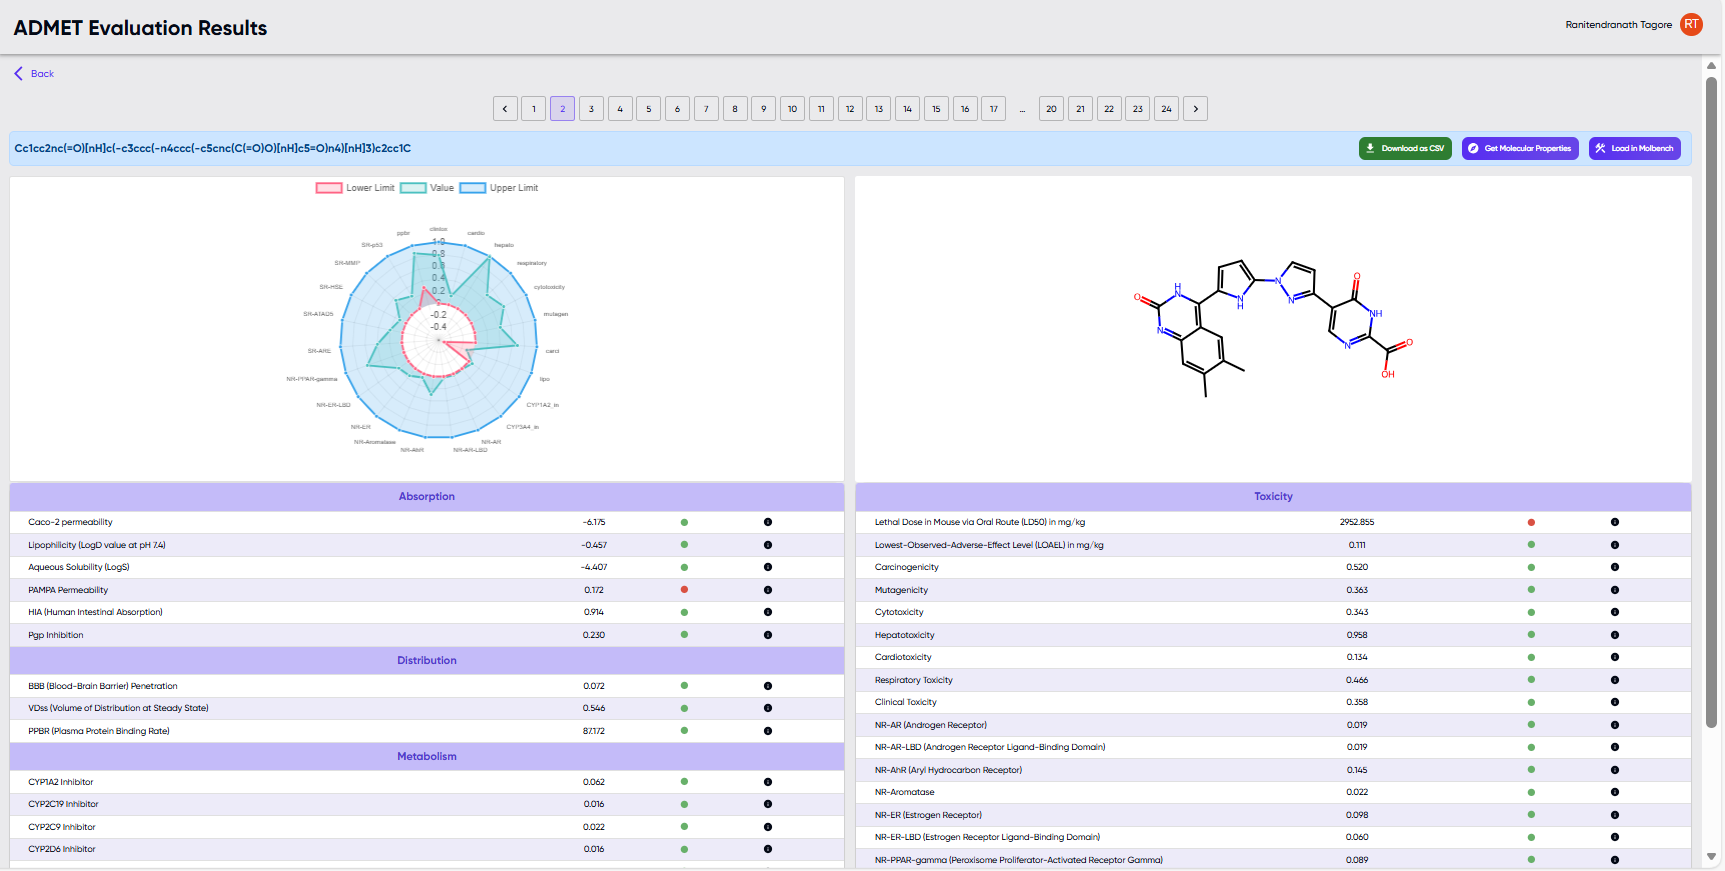
Figure 4: The results screen upon successful completion of a job submitted via the “Enter a SMILES string” option.
- The submitted SMILES and a radar chart of calculated properties are shown towards the top left. The radar chart shows the values of the properties for the given molecule as a green line overlaid with the desired upper and lower limits of these parameters shown as blue and red lines, respectively.

- The 2D structure corresponding to the submitted SMILES is displayed to the right of the radar chart.
- Below the radar chart and the 2D structure, the computed properties are displayed in tabular form, along with a green or red dot indicating whether the values are within or outside (respectively) the upper and lower limits. Hovering over the black dot to the right of the green/red dot reveals a description of the particular ADMET parameter.
- Above the 2D diagram, there are buttons for (i) downloading the table of results as a .csv file, (ii) displaying additional medicinal chemistry properties (by opening the molecule in the “Screenie” module), and for (iii) loading the molecule in the molecule editor module (“MolBench”).
(B) “Browse” option
Upon successful completion of a job submitted via the “Browse” option, the “Visualize Results” and “Download Results” options become available in the jobs table. The results table displayed upon clicking the “Visualize Results” option is shown in Figure 5. Values in green and red indicate values that lie within and outside, respectively, of the default or modified ranges described further below.
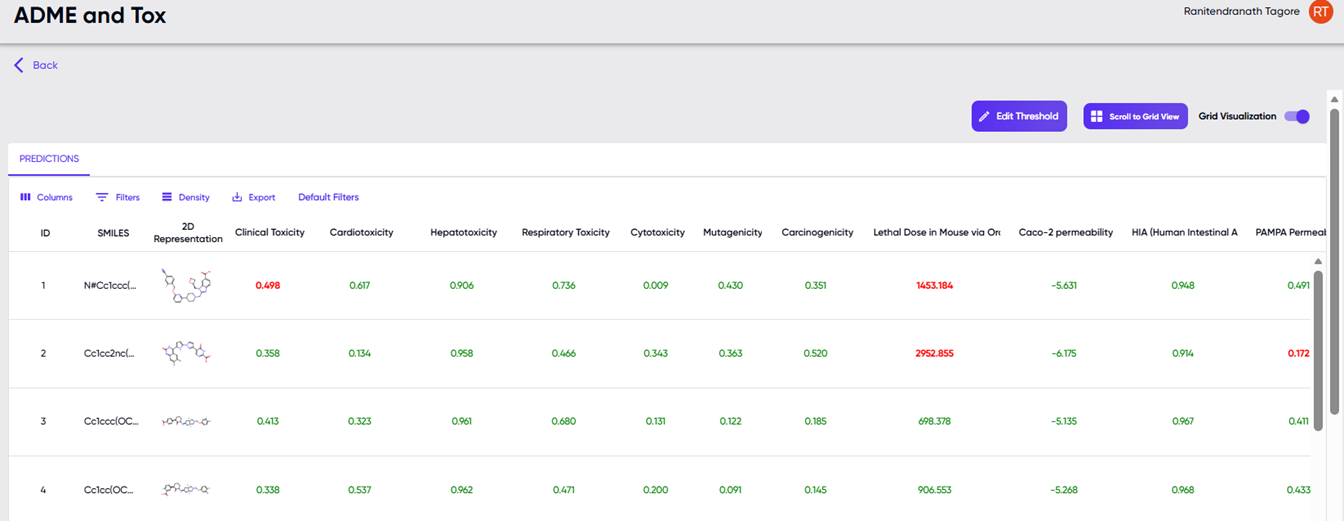
Figure 5: The table displayed upon clicking the “Visualize Results” option.
Besides the table of values of computed ADMET parameters (in columns) for each input SMILES (in rows), the screen also provides filtering and display options. A drop-down menu is available upon clicking the “Columns” button, where the user can specify which of these columns should be displayed in the table. Each of these properties can also be used as sorting and filtering criteria. Sorting can be performed by clicking the arrow button that appears upon hovering over any column header, and the filtering function can be accessed via the drop-down menu in the “Filters” button. The height of the rows can be adjusted via the “Density” button, and the “Export” button provides the option to download the properties table as a “.csv” file. The “default filters” button provides a quick way to reset the filters to their default values. Changes can be made to the filter values via the “edit thresholds” button above the results table, towards the right. A grid view of the results table is available via the “scroll to grid view” button to the right of the “edit thresholds” button. Note: The “scroll to grid view” button is greyed out, unless activated by toggling the “grid visualization” toggle switch to the right of the button. Upon selecting a particular row of the properties table, the properties of the molecule in that row are visualised as illustrated in Figure 4.
The pop-up dialogue that appears upon clicking the “edit thresholds” button is shown in Figure 6. At the top of the dialog box is the slider and value fields for setting thresholds globally for all ADMET endpoints, while the sliders and value fields for individual endpoints are listed below it. The user can choose to use the sliders to set the percentile values (the percent of approved drugs that will fall above and below the selected upper and lower limits), or they may choose to edit the values in the upper and lower limit text boxes. When either the slider or the numerical value fields are modified, the other field auto-updates to reflect the changes. The user may also specify the thresholds by uploading a .json file of the threshold values, and download the current threshold values as a .json file (via the “upload” and “download” buttons, respectively, at the bottom left of the dialog box).
The view available via the “scroll to grid view” button is shown in Figure 7. Larger 2D structure cards of the molecules in the results table are available here, and clicking upon any of the cards pops it out in a still larger view along with its SMILE string (Figure 8).
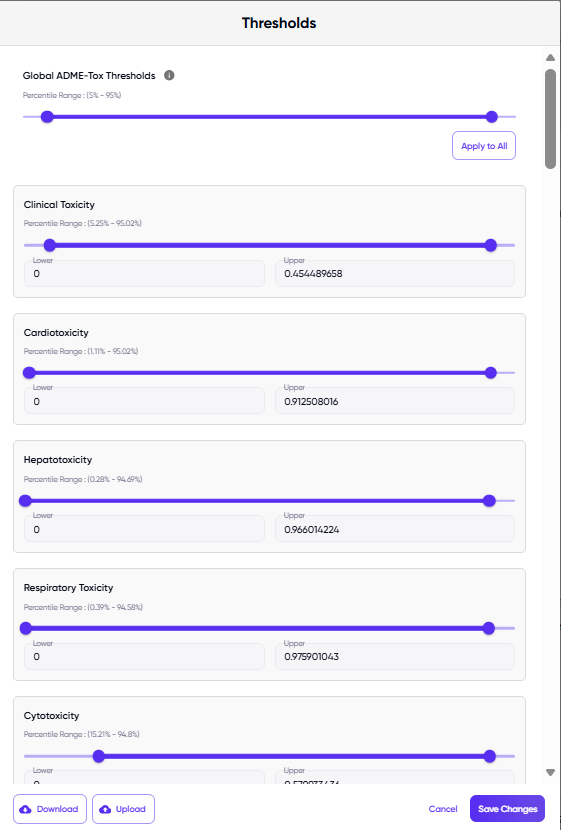
Figure 6. The dialog box displayed upon clicking the “edit thresholds” button.
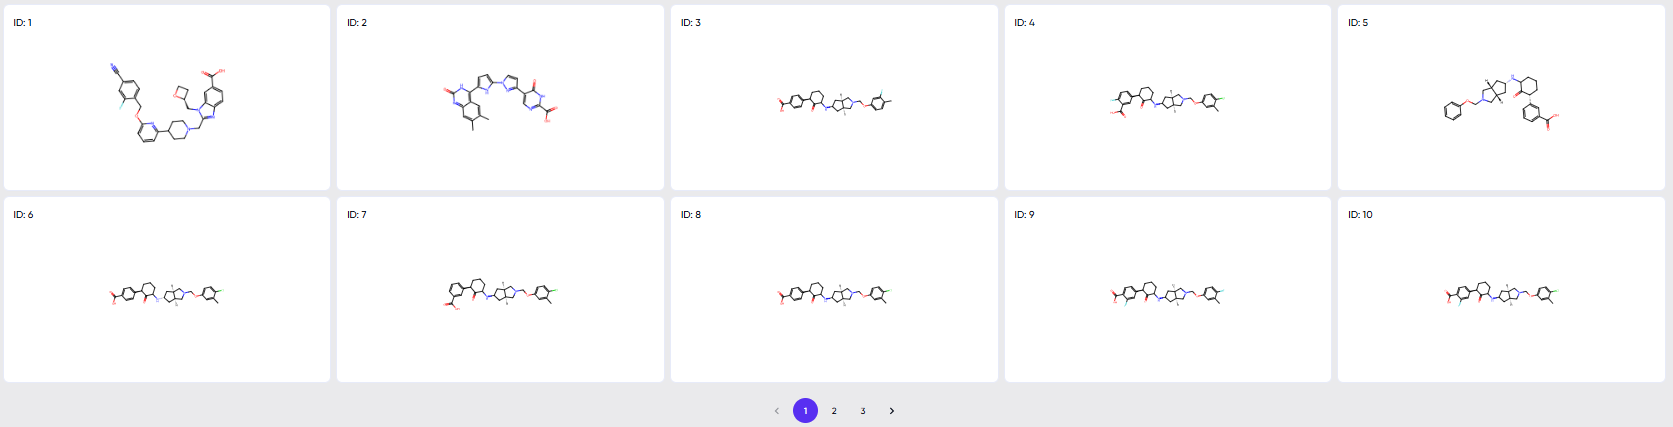
Figure 7. The view available via the “scroll to grid view” button.
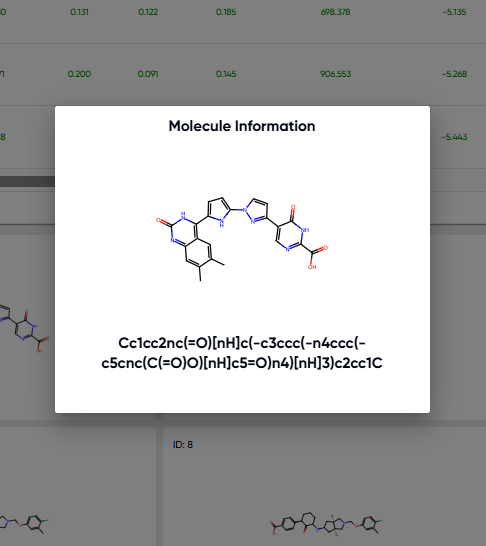
Figure 8. Pop-out available upon clicking any of the 2D structure cards in grid view.
(C) ADMET properties
The ADMET properties calculated are:
-
Absorption
1.1. Caco-2 permeability: This measures how well a compound can permeate through Caco-2 cells, a type of cell line derived from human colon carcinoma. The displayed value is a log of permeability values, with permeability in cm/s, indicating the ease with which a molecule can cross cell membranes, an important factor in drug absorption. A higher value suggests better permeability and a likelihood of better absorption.
1.2. Lipophilicity (logD value at pH 7.4): Lipophilicity represents the compound's ability to dissolve in fats, oils, and non-polar solvents, versus in water. The logD value at pH 7.4 (physiological pH) provides an understanding of a compound's distribution between water and octanol (nonpolar) at this pH. This property influences a molecule's absorption, distribution, metabolism, and excretion in the body.
1.3. Aqueous Solubility (log S): This predicts the solubility of a compound in water, expressed as logS where S is in molarity (M). Solubility is crucial for a compound's bioavailability and absorption. Poor solubility can lead to low effectiveness of a drug. The higher the logS value, the more soluble the compound in water.
1.4. PAMPA Permeability: The Parallel Artificial Membrane Permeability Assay (PAMPA) is a method to predict the permeability of compounds. This endpoint estimates the probability of a molecule to permeate through a membrane, simulating intestinal absorption. It's a useful tool for early-stage drug screening to assess a compound's ability to be absorbed.
1.5. HIA (Human Intestinal Absorption): This measures the likelihood of a compound being absorbed through the human intestine. High HIA is often necessary for oral effectiveness of drugs. This metric helps in understanding how much of a drug can enter systemic circulation following oral administration.
1.6. Pgp Inhibition: P-glycoprotein (Pgp) is a protein that pumps foreign substances out of cells. This endpoint predicts the likelihood of a compound inhibiting this protein. Pgp inhibition can impact drug absorption and distribution, particularly for drugs targeting the brain or cancer cells. Drugs that inhibit Pgp might increase the effectiveness of other drugs by enhancing their absorption or reducing their expulsion from cells.
-
Distribution
2.1. BBB (Blood-Brain Barrier) Penetration: This metric predicts the likelihood of a molecule being able to cross the blood-brain barrier (BBB), a highly selective and protective barrier that separates the brain from the circulatory system. Effective BBB penetration is crucial for drugs targeting the central nervous system. The higher the penetration probability, the more likely a compound can affect brain functions or treat neurological disorders.
2.2. VDss (Volume of Distribution at Steady State): This metric predicts VDss, measured in liters per kilogram (l/kg). The volume of distribution at steady state is a pharmacokinetic parameter that describes the extent to which a drug distributes into body tissues away from the bloodstream. It helps in understanding how a drug is dispersed in the body and is key to determining dosing regimens. Generally, a larger VDss indicates more extensive distribution into tissues.
2.3. PPBR (Plasma Protein Binding Rate): This metric predicts the percentage of a drug that remains unbound to plasma proteins in the blood. The unbound fraction of a drug is usually pharmacologically active, so knowing the PPBR is important for assessing a drug's efficacy and potential interactions. High plasma protein binding can affect the drug's distribution, elimination, and overall therapeutic effect.
-
Metabolism
3.1. CYP1A2 Inhibitor: Estimates the probability that a compound will inhibit CYP1A2, a key enzyme in drug metabolism. Inhibiting CYP1A2 can alter the effectiveness and safety of medications metabolized by this pathway. Inhibitors of CYP1A2 can affect the metabolism of drugs processed by this enzyme, potentially leading to increased drug levels and adverse effects.
3.2. CYP2C19 Inhibitor: Estimates the probability that a compound will inhibit CYP2C19, a key enzyme in drug metabolism. Inhibiting CYP2C19 can alter the effectiveness and safety of medications metabolized by this pathway. Inhibitors of CYP2C19 can affect the metabolism of drugs processed by this enzyme, potentially leading to increased drug levels and adverse effects.
3.3. CYP2C9 Inhibitor: Estimates the probability that a compound will inhibit CYP2C9, a key enzyme in drug metabolism. Inhibiting CYP2C9 can alter the effectiveness and safety of medications metabolized by this pathway. Inhibitors of CYP2C9 can affect the metabolism of drugs processed by this enzyme, potentially leading to increased drug levels and adverse effects.
3.4. CYP2D6 Inhibitor: Estimates the probability that a compound will inhibit CYP2D6, a key enzyme in drug metabolism. Inhibiting CYP2D6 can alter the effectiveness and safety of medications metabolized by this pathway. Inhibitors of CYP2D6 can affect the metabolism of drugs processed by this enzyme, potentially leading to increased drug levels and adverse effects.
3.5. CYP3A4 Inhibitor: Estimates the probability that a compound will inhibit CYP3A4, a key enzyme in drug metabolism. Inhibiting CYP3A4 can alter the effectiveness and safety of medications metabolized by this pathway. Inhibitors of CYP3A4 can affect the metabolism of drugs processed by this enzyme, potentially leading to increased drug levels and adverse effects.
3.6. CYP2C9 Substrate: Predicts the probability of a drug being a substrate for CYP2C9 i.e., the likelihood whether a drug compound is likely to be metabolized by the CYP2C9 enzyme. Understanding, if a drug is a substrate, helps in anticipating its metabolism mechanism.
3.7. CYP2D6 Substrate: Predicts the probability of a drug being a substrate for CYP2D6 i.e., the likelihood whether a drug compound is likely to be metabolized by the CYP2D6 enzyme. Understanding, if a drug is a substrate, helps in anticipating its metabolism mechanism.
3.8. CYP3A4 Substrate: Predicts the probability of a drug being a substrate for CYP3A4 i.e., the likelihood whether a drug compound is likely to be metabolized by the CYP3A4 enzyme. Understanding, if a drug is a substrate, helps in anticipating its metabolism mechanism.
-
Excretion
4.1. Half-Life Estimate: Estimates the half-life of a molecule with units in hours. The half-life is the time it takes for the concentration of the drug in the body to be reduced by half. This is a crucial pharmacokinetic parameter that helps determine the dosing frequency and duration of a drug's effect. A longer half-life means the drug stays in the body for an extended period, which could allow for less frequent dosing.
-
Toxicity
5.1. Lethal Dose in Mouse via Oral Route (LD50): The model predicts the LD50, which is the dose required to kill 50% of a test population (units: mg/kg). This measure is used to assess the acute toxicity of a substance. In drug development, the LD50 value helps in understanding the safety margin of the compound. The higher the LD50 value, the lower the toxicity of the compound, indicating a larger safety margin.
5.2. Carcinogenicity: This metric predicts the probability of a molecule being carcinogenic, i.e., having the potential to cause cancer. Carcinogenic compounds can lead to the development of cancerous cells over time, making this a critical safety assessment in drug development.
5.3. Mutagenicity: This metric estimates the probability of a molecule being mutagenic, which means it can cause genetic mutations. Mutations can lead to various health problems, including cancer, making this a key parameter for assessing genetic risk.
5.4. Cytotoxicity: This metric measures the probability of a molecule being cytotoxic, meaning it can be toxic to cells. Assessing cytotoxicity is important for understanding a drug's potential to cause cell damage or death, which can lead to adverse effects in the body.
5.5. Hepatotoxicity: This metric predicts the likelihood of a compound being hepatotoxic, or toxic to the liver. The liver is a vital organ for drug metabolism, so hepatotoxicity is a major concern in pharmaceuticals, as it can lead to liver damage or failure.
5.6. Cardiotoxicity: This metric measures the probability of a compound being cardiotoxic, specifically focussing on hERG blockage (a potassium channel in the heart) with an IC50 cutoff of 10 micromolar. Cardiotoxicity can lead to heart-related adverse effects, making this an important parameter for drugs that may affect cardiovascular health.
5.7. Respiratory Toxicity: Estimates the probability of a molecule causing respiratory toxicity. Compounds that are toxic to the respiratory system can cause breathing difficulties, lung damage, or other pulmonary issues.
5.8. Clinical Toxicity: This general category metric predicts the overall probability of a molecule causing adverse effects in a clinical setting. It encompasses a broad spectrum of potential toxic effects that a drug might have when administered to patients.
5.9. NR-AR (Androgen Receptor): This metric is from the Tox21 dataset that predicts the interaction with the androgen receptor, which is important for understanding the impact on male reproductive health and the potential for endocrine disruption.
5.10. NR-AR-LBD (Androgen Receptor Ligand-Binding Domain): This metric is from the tox21 dataset and predicts the potential binding to the ligand-binding domain of the androgen receptor, which is crucial for the receptor's activation and subsequent adverse biological effects.
5.11. NR-AhR (Aryl Hydrocarbon Receptor): This metric is from the Tox21 dataset and estimates the interaction with the aryl hydrocarbon receptor, which plays a role in the body's response to certain environmental toxins, including dioxins.
5.12. NR-Aromatase: This metric is from the Tox21 dataset and predicts the impact on aromatase, an enzyme involved in estrogen synthesis. Inhibiting or modulating aromatase can affect estrogen levels and is relevant in conditions like breast cancer.
5.13. NR-ER (Estrogen Receptor): This metric is from the tox21 dataset and predicts the interaction with estrogen receptors, which is significant for understanding the effects on female reproductive health and the potential for endocrine disruption.
5.14. NR-ER-LBD (Estrogen Receptor Ligand-Binding Domain): This metric is from the Tox21 dataset and estimates the potential binding to the estrogen receptor's ligand-binding domain, impacting the receptor's activity.
5.15. NR-PPAR-gamma (Peroxisome Proliferator-Activated Receptor Gamma): This metric is from the tox21 dataset and predicts interactions with PPAR-gamma, a receptor that plays a key role in fat storage, glucose metabolism, and insulin sensitivity.
5.16. SR-ARE (Antioxidant Response Element): This metric is from the tox21 dataset and estimates the activation of the antioxidant response element pathway, which is involved in the cellular response to oxidative stress and detoxification.
5.17. SR-ATAD5: This metric is from the tox21 dataset and predicts the impact on the ATAD5 gene, which is linked to the cellular response to DNA damage and the maintenance of genomic stability.
5.18. SR-HSE (Heat Shock Element): This metric is from the Tox21 dataset and predicts the activation of the heat shock element, which is part of the cellular response to stress, particularly heat shock proteins.
5.19. SR-MMP (Mitochondrial Membrane Potential): This metric is from the Tox21 dataset and estimates the effects on mitochondrial membrane potential, important for understanding mitochondrial dysfunction and cytotoxicity.
5.20. SR-p53: This metric is from the tox21 dataset and predicts the activation of the p53 pathway, a key regulator in the cellular response to DNA damage and an important factor in cancer biology.
5.21. Lowest-Observed-Adverse-Effect Level (LOAEL): Lowest concentration or dose of a substance at which there are observable adverse effects in the test subjects. We report the -log10(LOAEL) value, where LOAEL (mg/kg_bw/day) is estimated for rats (subject) assuming the molecule is chronically (>180 days) ingested via the oral route.