Results
(A) “Browse” option
Figure 2 illustrates the output of Screenie. The calculated properties are displayed in the “PROPERTIES” table (Label 1, Figure 2). The user may need to scroll horizontally and vertically to see all the columns for all submitted molecules. The width of each column may be adjusted by hovering over the edge lines of the column header and clicking and dragging the width adjustment cursor that appears. Each row of the table corresponds to one submitted SMILES string, and by simply clicking over that row, the user can get the detailed property view of that SMILES/ligand (please see ‘Results section (B) “Enter a SMILES string” option’)
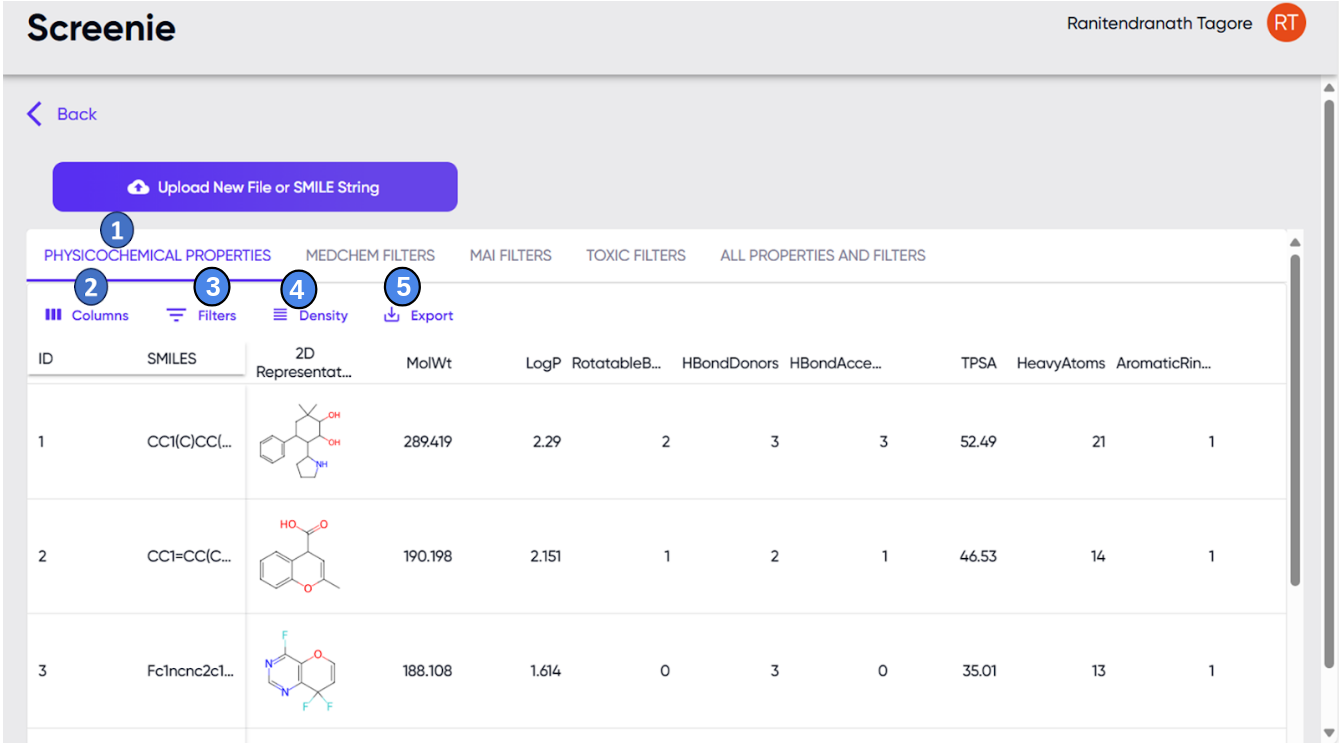
Figure 2. The Screenie module output screen. 1 - properties display table; 2 - drop-down list of columns available for display.
3 - option for selecting molecules falling within particular ranges for the parameters in the columns, using operators such as >, <, = etc. 4 - options for adjusting the thickness and number of rows displayed in the results table. 5 - option of downloading a .csv file of the results.
The columns available for each row are as follows:
Under “PHYSICOCHEMICAL PROPERTIES”
- ID - A serial integer assigned to the SMILES strings in the order they appear in the input “.csv” file.
- SMILES - The input SMILES string.
- 2D Representation - The two-dimensional chemical structure representation corresponding to the submitted SMILES string.
- MolWt - Displays the molecular weight in Daltons. The value is usually desired to be kept within an upper limit for drug candidates.
- LogP - Displays the predicted value of the logarithm of the partition coefficient of the molecule between n-octanol and water. This is a measure of the lipophilicity of the molecule, an important consideration for drug candidates.
- RotatableBonds - Displays the number of rotatable bonds, defined as non-ring single bonds with low rotational barriers, attached to a non-terminal non-hydrogen atom. The number of rotatable bonds is usually desired to be kept within an upper limit of less than 10.
- HBondDonors - Displays the number of hydrogen bond donors in the molecule. The value is usually desired to be kept within an upper limit for drug candidates.
- HBondAcceptors - Displays the number of hydrogen bond acceptors in the molecule. The value is usually desired to be kept within an upper limit for drug candidates.
- TPSA - Displays the Total Polar Surface Area (TPSA) in units of Å2. The value is usually desired to be kept within an upper limit for drug candidates.
- HeavyAtoms - Displays the number of “heavy”, or non-hydrogen, atoms. This number is a parameter to be considered according to some drug-likeness rules.
- NumAromaticRings - Displays the number of aromatic rings in the molecule, which is thought to affect the developability and drug-likeness of a molecule.
- Fsp3 - The fraction of sp3 carbon atoms (Fsp3, number of sp3 hybridized carbons/total carbon count) count is a metric used in drug discovery to evaluate the degree of saturation and complexity in small molecules.
- QED - Displays the value of the Quantitative Estimate of Drug-likeness developed by Bickerton et al 2012. The value ranges between 0 to 1, with higher scores being desirable.
- SA Score - Displays the value of the Synthetic Accessibility (SA) metric, which is based on historical knowledge of synthetic ease of substructures or fragments of a molecule, combined with penalties for complexity (Ertl et al. 2009). The value ranges from 1 to 10, with lower numbers implying easier synthesis.
- Undesired rings - Rings with sizes 3, 4, 8, 9, 10, or 11 atoms are considered undesirable due to difficulty in their synthesis and low prevalence among approved drug molecules.
Under “MOLECULE AI PROPRIETARY FILTERS”
The molecule AI proprietary filters are a set of in-house medchem filters designed to account for special properties that we believe play a crucial role in drug discovery and drug-likeness.
- MAI Lipinski+ - An extended Lipinski filter that is based upon a broad range of physicochemical parameters that better evaluate the drug-likeness of molecules.
- Unwanted Substructures - Unwanted substructures are an in-house, curated list of fragments that filter and remove highly reactive and unfavourable substructures such as acid halides and Michael acceptors.
- MAI Rings - This function works based on a library of ring structures found in approved drugs (Taylor et al. 2014 and Shearer et al. 2022). The entry in this column indicates whether the molecule contains ring structures outside the library of rings in approved drugs. This knowledge could be an important factor in considerations of patentability, as well as of the likelihood of unexpected properties.
Under “MEDCHEM FILTERS”
Several medicinal chemistry rules recognized by the field are provided under this tab. The names of the columns indicate the names of the rule authors (e.g., the column for Lipinski’s rule of 5 is “Lipinski”), and the value in the column specifies whether the molecule passes or fails the rule. The criteria within these rules are available in the relevant literature.
Under “TOXICITY FILTERS”
- PAINS - This tab contains the “PAINS_A”, “PAINS_B”, and “PAINS_C” filters, which check for the presence of signatures of Pan-Assay Interference compounds (PAINS). PAINS are molecules that are undesirable due to their artifactual responses in many assays relevant to the testing of potential drug molecules. PAINS signatures are further subdivided into the A, B, and C classes (Baell et al. 2010).
- Class A: Promiscuous reactors that are often highly reactive and form covalent adducts with proteins and assay reagents. Electrophilic compounds such as epoxides and Michael acceptors fall into this category.
- Class B: These are compounds that undergo redox reactions easily and can therefore reduce/oxidize assay components easily, leading to non-specific activity. Quinones are such examples.
- Class C: Aggregator or astringent compounds, cause physical aggregation/association of macromolecules or assay components that cause interference in assay results.
- BRENK - The BRENK filter scans for known toxicophores, undesirable functional groups, and structural alerts that negatively affect ADME properties (Brenk et al. 2008).
- NIH - NIH filter scans for compounds containing problematic functional groups annotated by NIH with known adverse effects (Jadhav et al. 2009).
- ZINC - In the ZINC filter, filtering is applied based on criteria related to drug-likeness and the presence of unwanted functional groups. More about ZINC-filters.
Under “ALL PROPERTIES AND FILTERS”
This tab consolidates the content of all the other tabs described above.
A drop-down menu is available upon clicking the “Columns” button (label 2, Figure 2), where the user can specify which of these columns should be displayed in the “PROPERTIES” table. Each of these properties can also be used as sorting and filtering criteria. Sorting can be performed by clicking the arrow button that appears upon hovering over any column header, and the filtering function can be accessed via the drop-down menu in the “Filters” button (label 3, Figure 2). The height of the rows can be adjusted via the “Density” button (label 4, Figure 2), and the “Export” button (label 5, Figure 2) provides options to download the properties table as a “.csv” file and/or to print to a “.pdf” file or a printer.
Upon clicking on any of the rows of the properties table, the row gets selected, and a 3D view of the molecule is displayed in the 3D view panel to the right of the screen (Figure 3). The view is interactive and can be zoomed and rotated using the mousepad. The functions of the various icons in the view panel are described in the section on the “Dr Viz” module.

(B) “Enter a SMILES string” option
The results screen upon successful completion of a job submitted via the “Enter a SMILES string” option is shown in Figure 3.
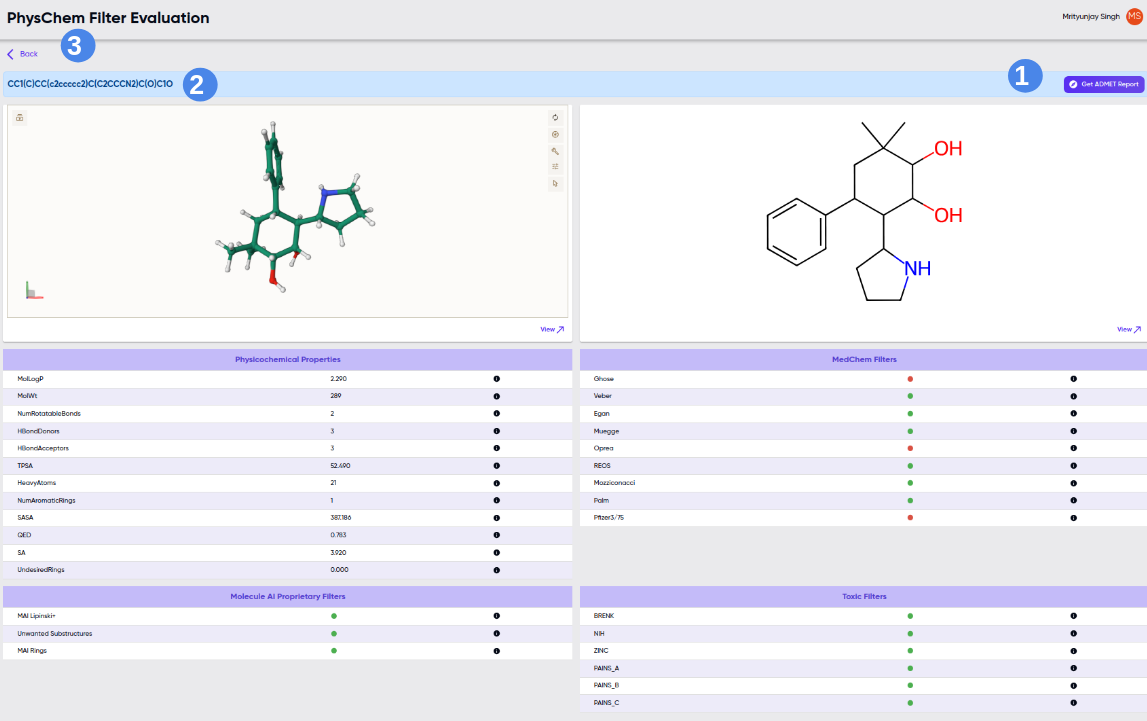
Figure 3. Results screen upon successful completion of a job submitted via the “Enter a SMILES string” option. 1- get ADMET report*; 2- SMILES, detailed physicochem properties along with 2D and 3D view; 3- back option to dashboard (Single SMILES string mode) and result table (Browse option, Figure 2).
*get ADMET report: Please see ADMET user manual Figure 4.