Results
The LIFT visualizer provides the following as output from a submitted job:
- Visual depiction of non-covalent interactions (Figure 3).
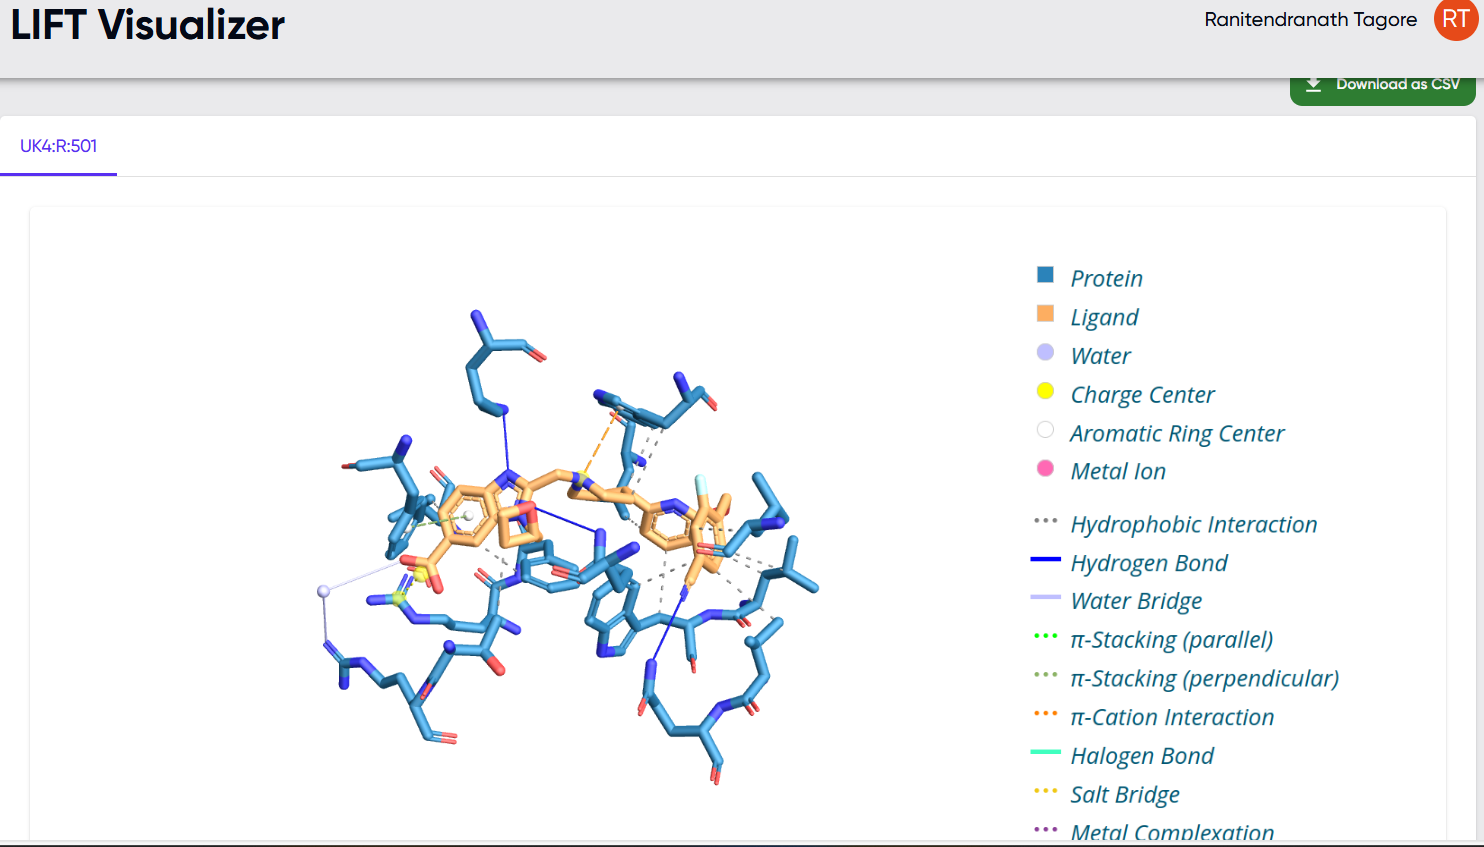
Figure 3. Visual depiction of non-covalent interactions for the submitted ligand-protein pair. The ligand is represented in yellow, the protein in blue. Various types of non-covalent interactions between pairs of atoms are indicated by various types of lines as indicated in the legend at the right of the screen.
- Tabular list of non-covalent interactions, segregated by type (Figure 4). For each entry under each type of interaction, information on the geometry of the interaction, and the participating atoms and residues are provided. The information in the tables can be downloaded as a .csv file via the “Download as CSV” button (Figure 3, upper right corner).
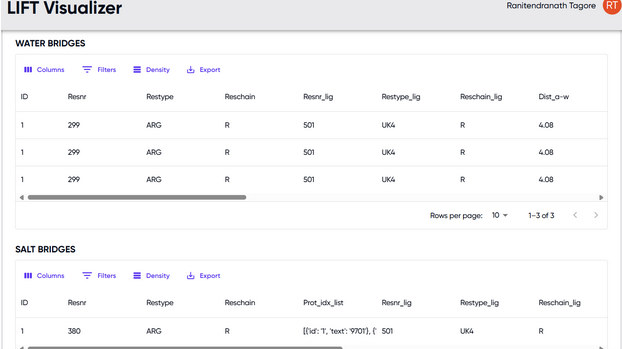
Figure 4. Tabular list of non-covalent interactions, segregated by type. For each entry under each type of interaction, information on the geometry of the interaction, and the participating atoms and residues are provided.