Output
For .csv file inputs
- The pop-up “Job submitted” appears at the top of the job queue
- The submitted jobs appear in the queue (Figure 3) with the status “Started” or “Received”.
- The user can view the information about the job submitted in “Show” inside the “Job Details” header.
- The status of the job:
- “RECEIVED”: The job has been submitted, and is waiting in queue.
- “STARTED”: The job has been submitted and is running.
- “FAILURE”: The job has failed due to an internal technical error.
- “SUCCESS”: The job has been completed successfully.
(In the “actions” section, the user can visualise/download the generated molecules for jobs with a “SUCCESS” status).
- Delete/Cancel: The user can optionally delete or stop the submitted jobs.
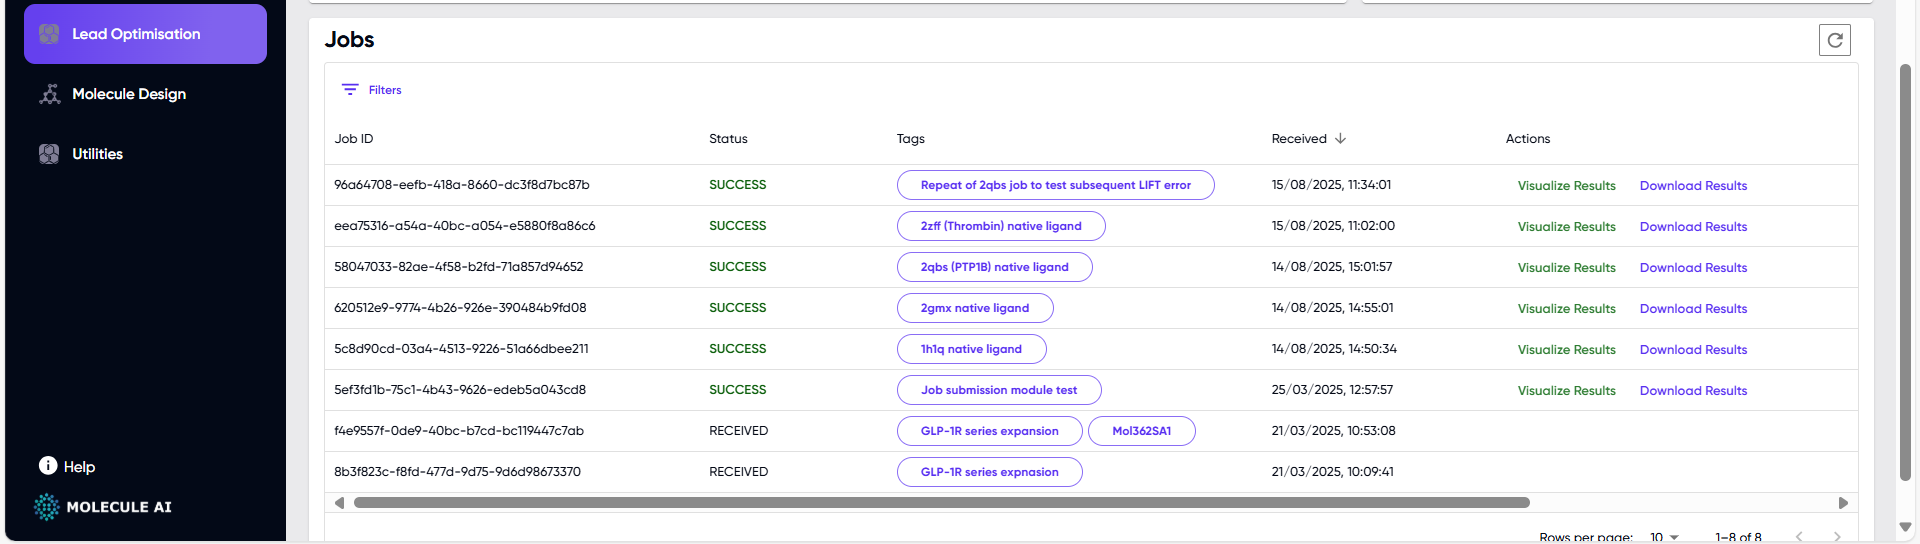
Figure 3: Job queue table. Other columns described above in the text can be seen upon scrolling to the right.
For single SMILES string input
- For a successfully submitted job, “BioSwap Models Running” pops up in blue (Figure 4).
- A green pop-up reading “BioSwap request finished successfully. Click Here” replaces the blue pop-up upon completion of the job. Press “Click Here” to visualise the generated molecules.
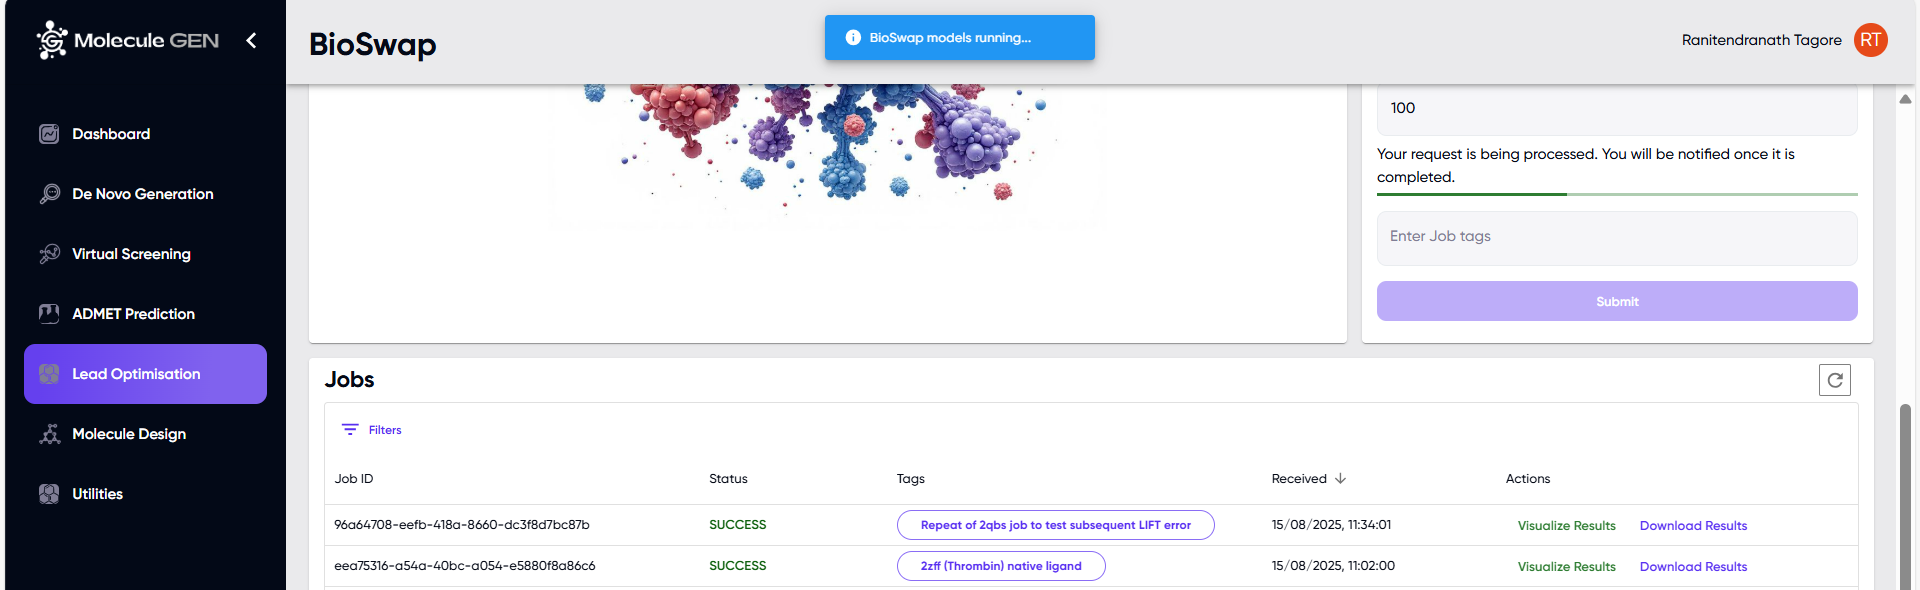
Figure 4: Job submission notification for single SMILES input.
Results
-
The output is shown in different formats across 3 tabs for a single SMILES input:
- Molecules: This section displays the table of results, including the input and output molecules, the group replaced, and the physicochemical properties as shown in Figure 5. This table can be filtered based on these properties and downloaded.
This section also shows a grid of 2D diagrams of the output molecules, which corresponds to the column “GEN-MOL-SMI” in the table (Figure 6).
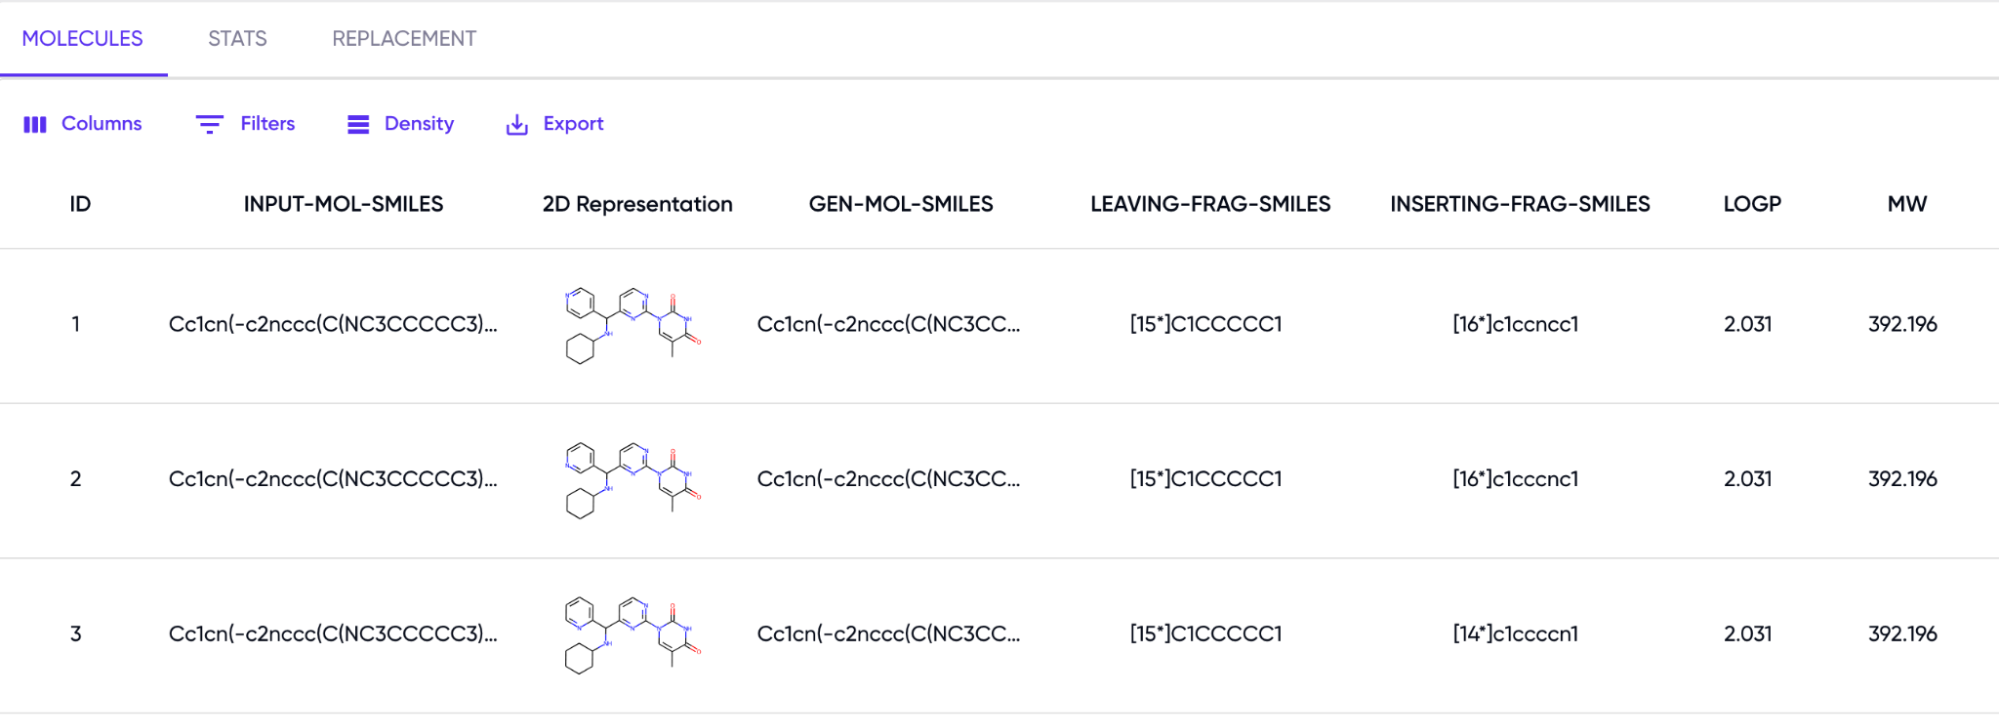
Figure 5: Table of Generated Molecules and Physicochemical Properties.
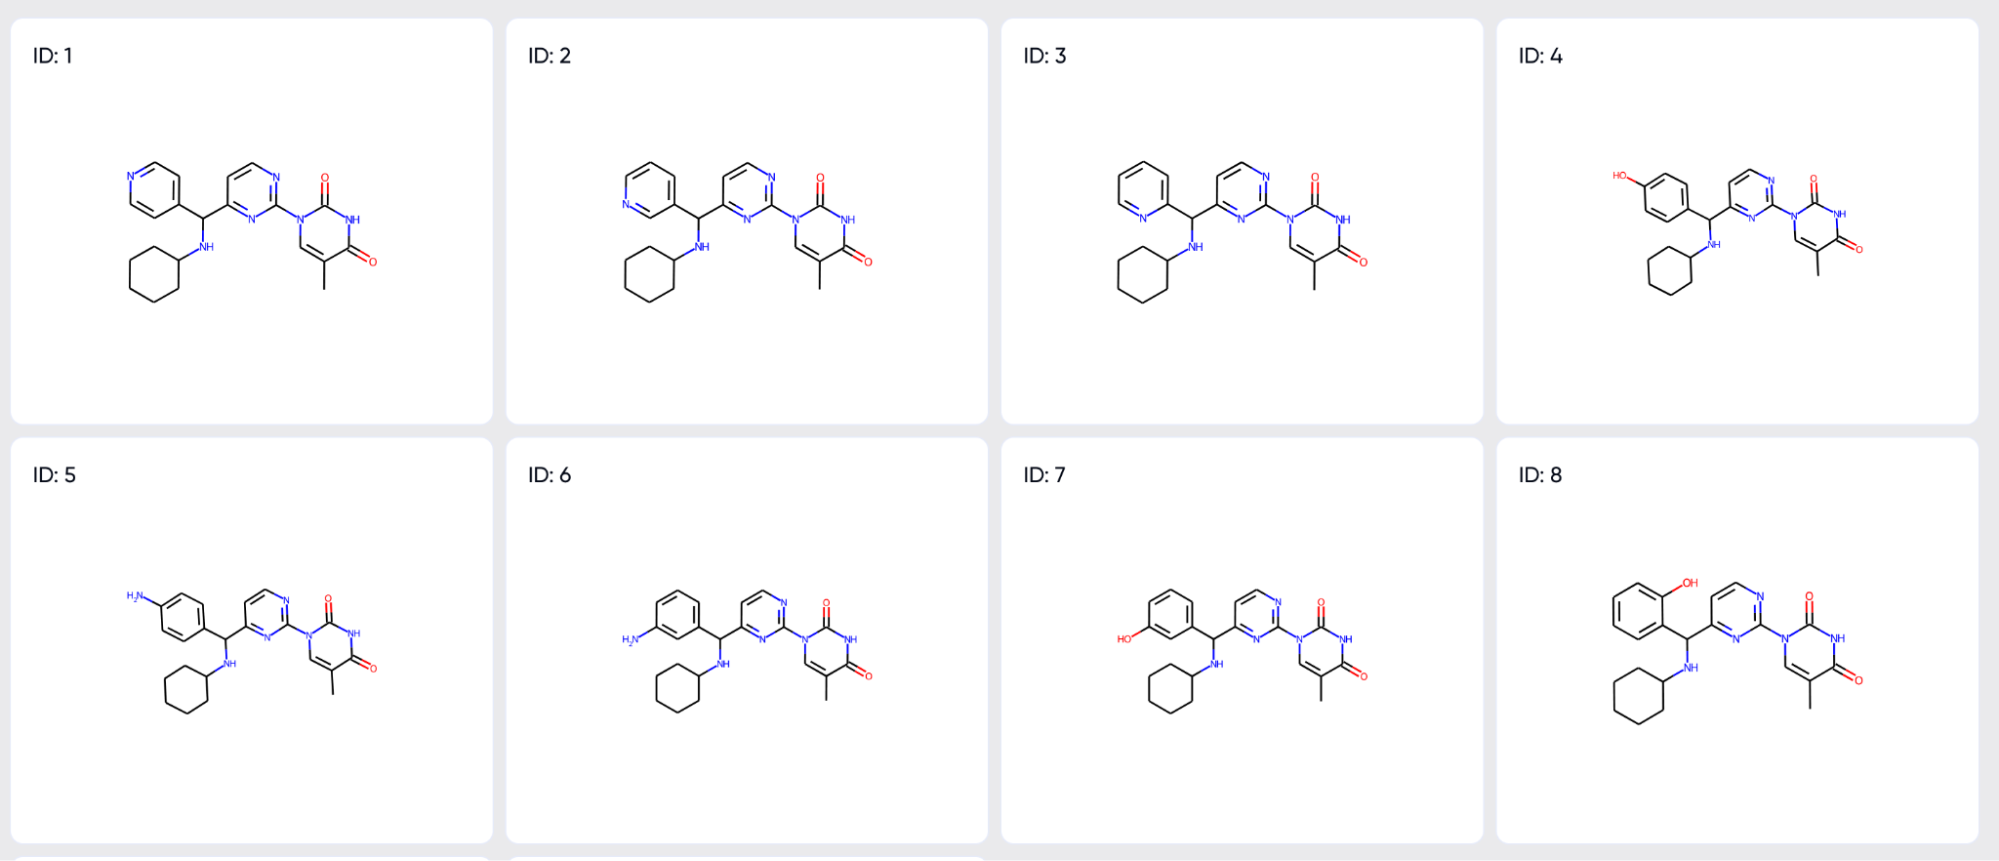
Figure 6: Grid of 2D representations of Generated Molecules
- Stats: This section includes the following plots:
- Properties of the reference molecule: the QED, SA, Mol. Wt. and logP of the input are displayed.
- Distribution of the properties of generated molecules (Figure 7). The red line corresponds to the reference.
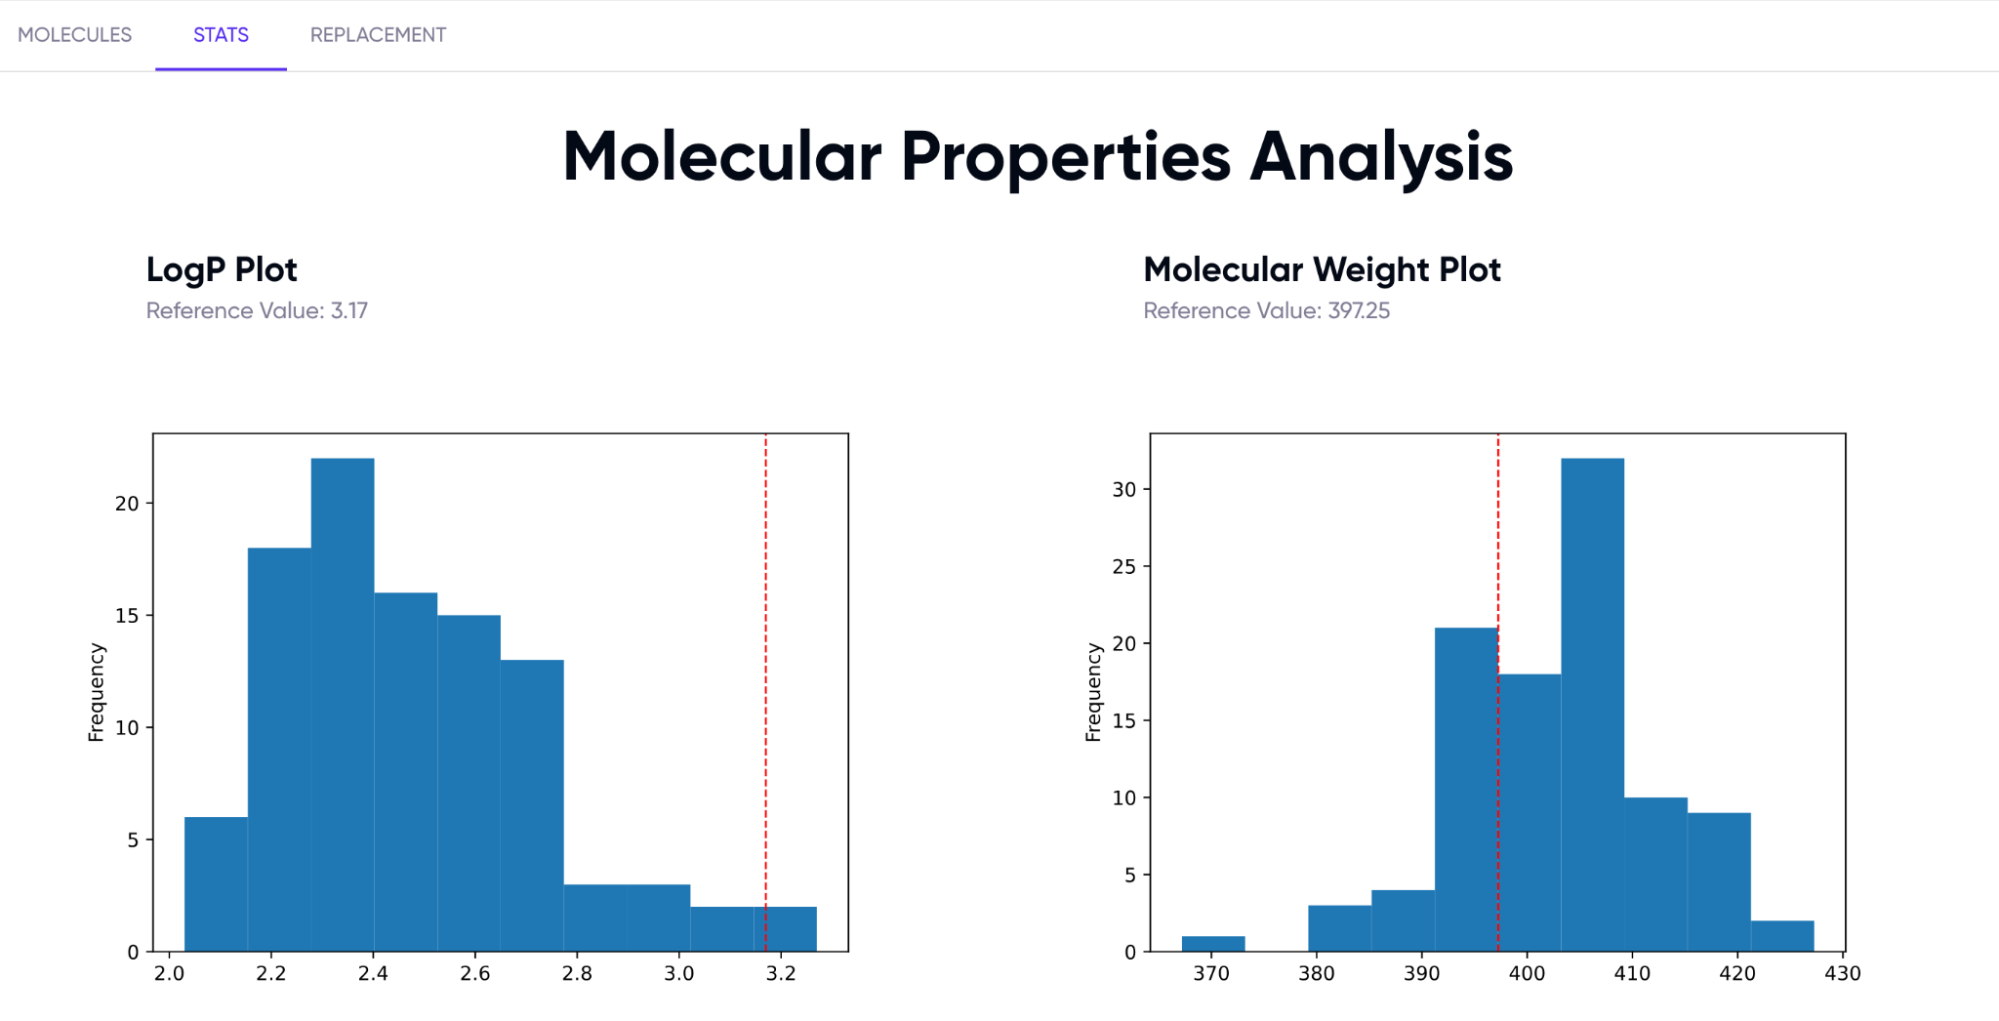
Figure 7: QED, logP, Mol.Wt and SA score plots for the generated molecules
- Replacement: This tab shows a list of the most frequently replaced fragments for each leaving group. Each row describes a single removed fragment, and the groups by which it was replaced by the model in descending order of frequency (Figure 8).
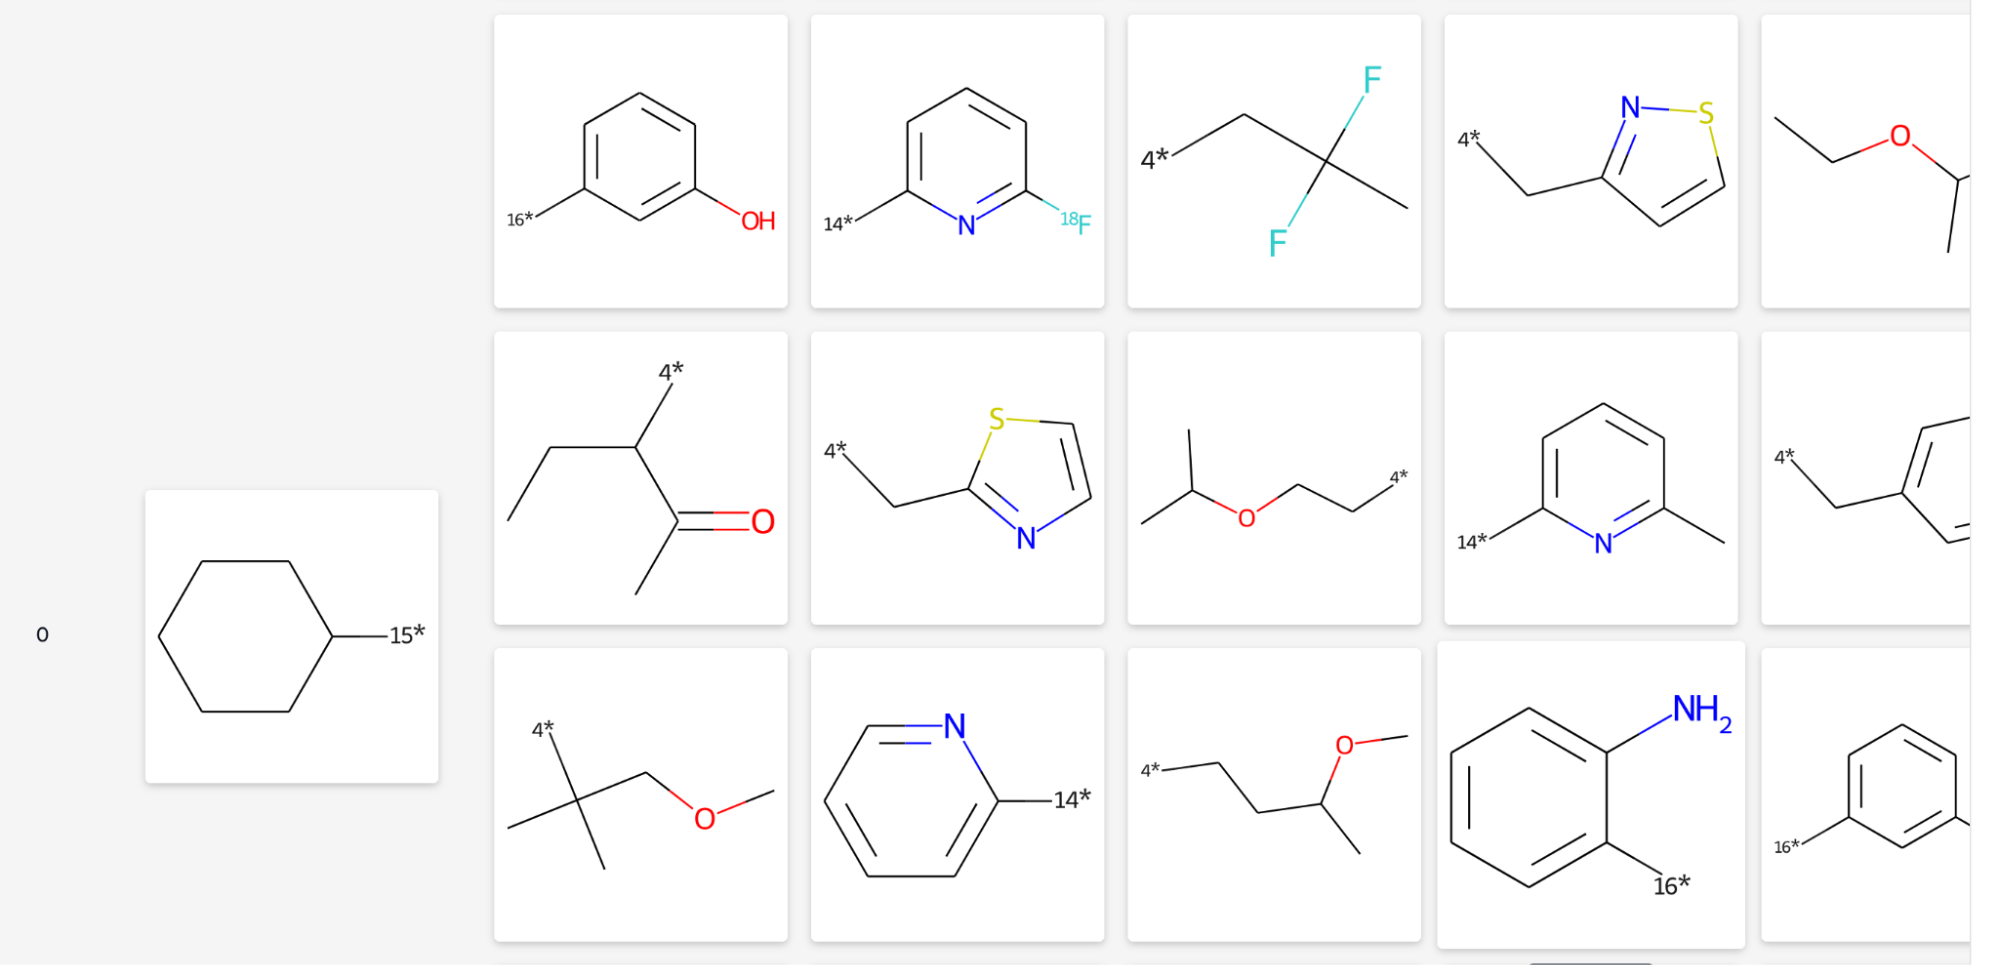
Figure 8: Table of removed and inserted fragments
- Molecules: This section displays the table of results, including the input and output molecules, the group replaced, and the physicochemical properties as shown in Figure 5. This table can be filtered based on these properties and downloaded.
-
For a .csv file input, the output is shown under a single tab, “Molecules”, as opposed to the 3 tabs described above for a single SMILES input. The contents of the “Molecules” tab is as described for a single SMILES input.